Soft Matter Hacker Blog |
 |
|---|
Home - Research - Publications - Blog - Talks - About
Twitter | Instagram | LinkedIn | Google Scholar | Scopus | ResearchGate | UNSW | YouTube
Jan 22, 2017 - ImageJ: Counting touching circles to evaluate emulsion droplets
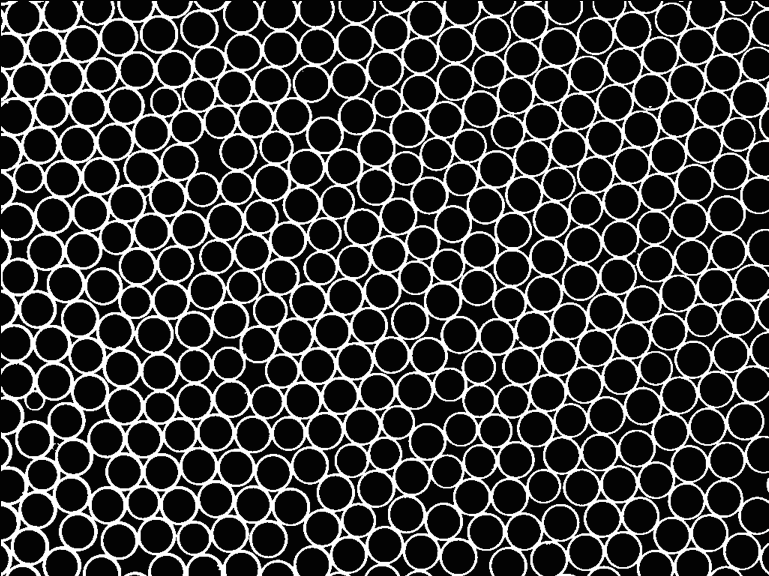
Image processing saves a LOT of time in your research, but we can’t always rely on the default menu choices to do everything, even in fantastic software like ImageJ. One need of microfluidics researchers is the separate size analysis of spherical (circular in 2D) droplets that are very similar in size but are mostly touching.
Most image analysis approaches require you to have separate particles in your sample before they can be automatically identified during processing, so to analyze an image like the one below we need to perform some extra pre-processing steps.
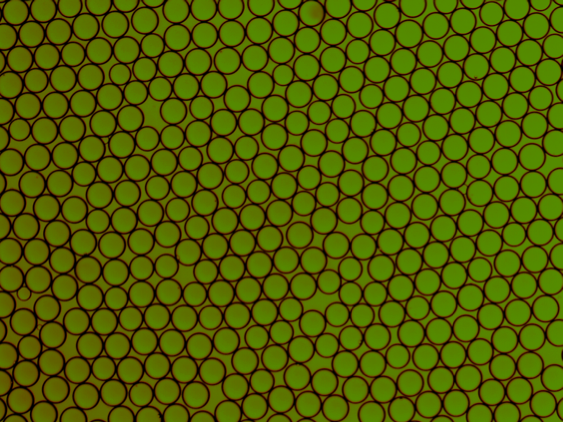
Starting image of droplets, made by Zengyi Wei.
The first step is to make the image 8-bit using: Image->Type->8-bit:
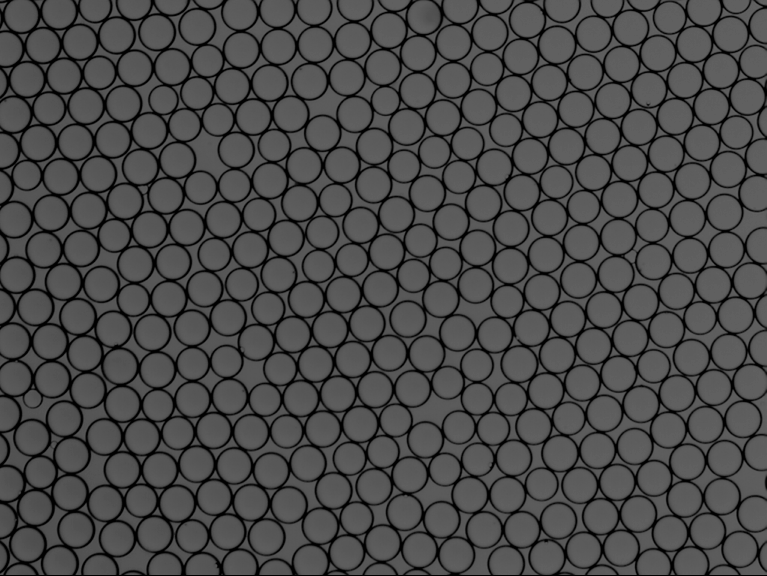
Grayscale image converted from above.
Then binarize the image using Image->Adjust->Threshold:
Binary image of circles.
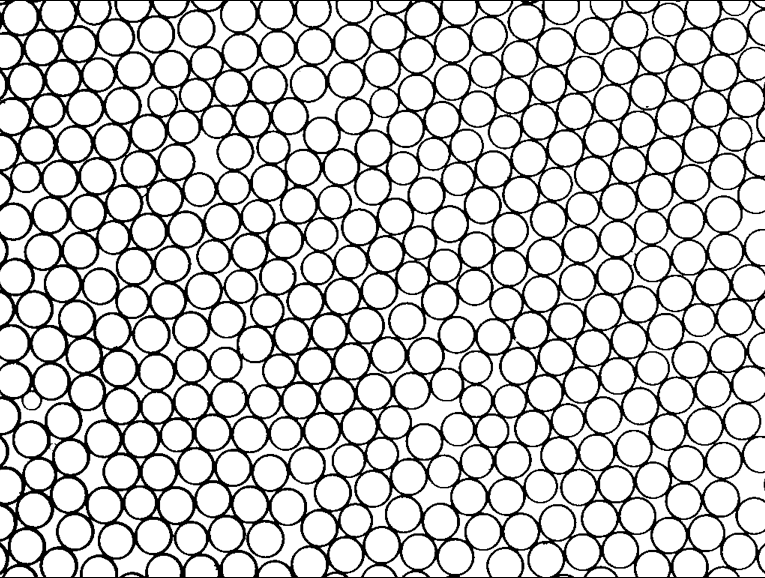
Now invert the image using: Edit->Invert:
Inverted image
Now we have a clear boundary between particles.
This also creates ‘particles’ in between the circles, but we can deal with this in the next step.
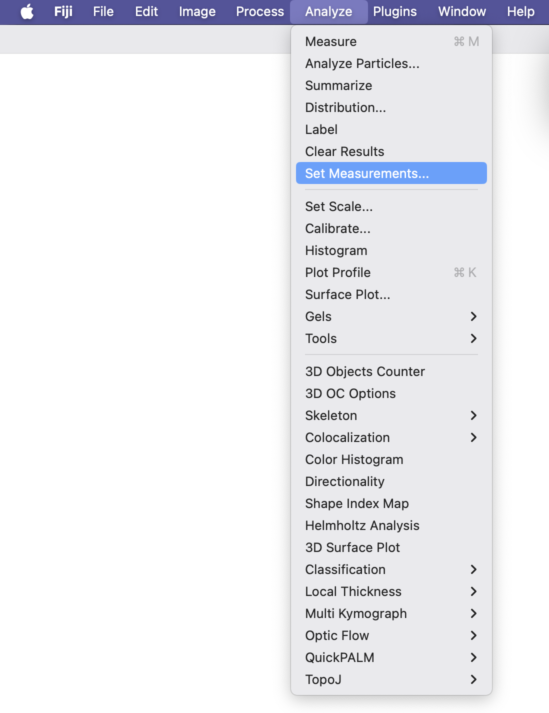
Now for Neel we need to set up the measurements we want to do for the particle finding and sizing. First choose Analyze - Set Measurements:
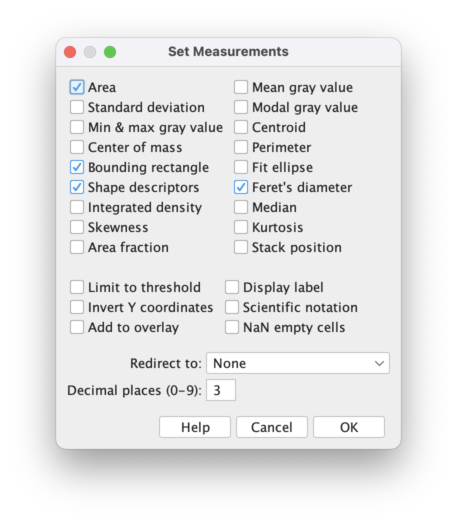
Then a box will pop up where you can select the measurements you want. I always choose Area, since it is just the number of pixels for an object and can be converted to intensity and size later without worrying about shape. The other ones are defined on the ImageJ wiki and describe shape and dimensions for irregular, non-spherical, particles well.
Run Analyze-Particles with the parameters shown in the below image (the key one seems to be a high minimum
circularity, which is very selective for circles and avoids the interstitial shapes that are very non-circular):
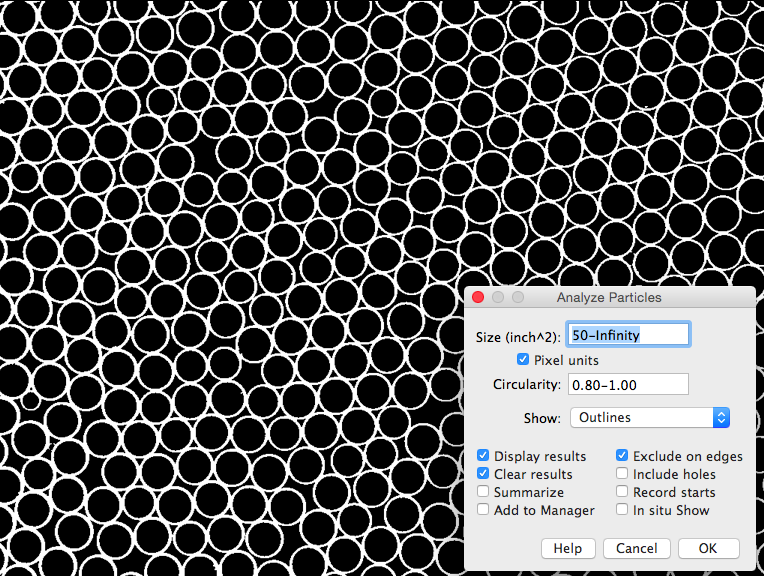
Analyze those circles!
ImageJ finds the below circles, they are undersized because it ignores their wall thickness,
but if you are focused on the polydispersity of the distribution this won’t matter as much.
You could easily post-correct the under-estimate because you know the pixel size of the border that is ignored.
It misses a few, so feel free to tweak my settings.
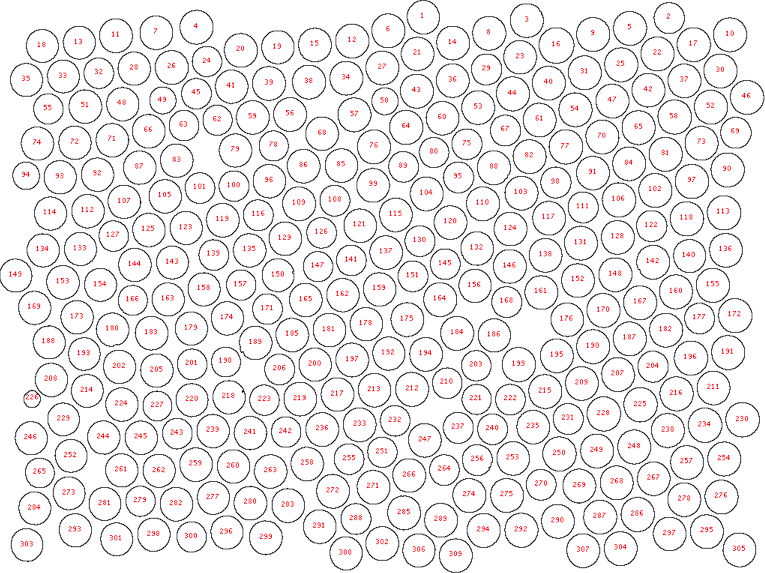
Found most of them!
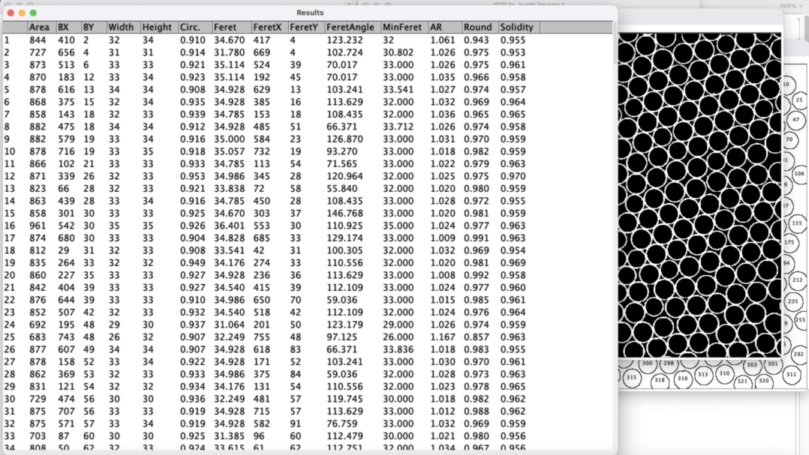
The raw data from the particle finding process is also displayed in a window,
helpfully called Results, that can be
saved to a text file and easily opened in Excel or your favorite coding package.
It lists the parameters you specified in Set Measurements and each one is listed with an
index number that matches the number on the droplet in the image above. If you are doing
post-processing that requires locations, such as fractal dimension determination for
a bunch of aggregates, then you will need to make sure to select Center of Mass
or something else that will
output particle coordinates when you Set Measurements. For now we have a nice
list of drop widths and heights, that
are almost identical since these are so circular, and this can be turned into a particle
size distribution by binning, or getting a frequency distribution of the numbers below.
These measurements are given in pixels so you will need to convert them to a known length
before or after calculating the size distribution. If you calibrate your image using a
known distance ahead of time, the results will be give in your chosen units.