Soft Matter Hacker Blog |
 |
|---|
Home - Research - Publications - Blog - Talks - About
Twitter | Instagram | LinkedIn | Google Scholar | Scopus | ResearchGate | UNSW | YouTube
Mar. 11, 2017 - ImageJ: Motion and change study via image analysis
Static image processing provides tremendous insights for a wide array of research areas. Analysis of phenomena that change with time is also possible when time-lapse imaging has been performed. There are many advantages to dynamic studies of this type. One is the ability to analyze things that happen over very short or very long time scales. Another is the study of motion. Taking this approach means we can use something as simple as a phone camera movie to develop a sophisticated and quantitative analysis.
Remember, movies of experimental behavior are simply stacks of individual images, or frames, that are played in rapid succession, usually around 24-30 discrete frames per second, to provide the illusion of continuous motion.
When we take images in the lab, we can control our camera to take individual frames at a specified rate, so we start out with a series of individual images.
When we use a phone camera or other movie camera, we sometimes start with a single movie file in MOV or AVI or MR4V format, for example. These are useful too but require additional steps to break the single movie file up into individual frames or images we can manipulate.
Other tutorials will address specifics, but examples of ways to deal with this are to use QuickTime Pro to split MOV files or FFMPEG to split almost any format movie file.
Here we will use examples of ImageJ’s functions, but will explain the concepts so that any solution or tool can ultimately be used.
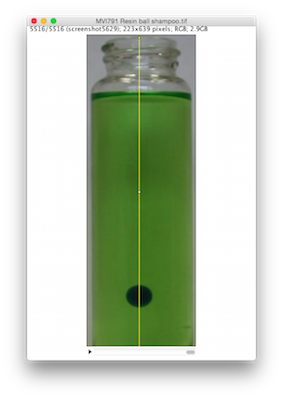
Example 1 - Sedimentation of a bead in a shampoo
Here we study the flow of a shampoo around a spherical resin bead with a diameter of 6.25 mm and a density of 1.2 g/cc. The bead is dropped into the shampoo and settles under gravity as it is more dense than the liquid.
Here’s a movie of the experiment:
It is slow! I’ve actually doubled the playback speed so it’s even slower than it seems. This shows how viscous the shampoo is! Flow is scaled down as viscosity goes up. So how do we study the experiment as a whole without boring ourselves to death and missing details?
If we load the images comprising this movie into ImageJ, we can perform a number of manipulations that convert a dynamic movie into a static image that helps to simplify quantification and makes it easier to show dynamic effects in a static setting, like a PowerPoint slide or a journal article.
Example 1a - The Montage
Montages are just frames of the movie arranged next to one another. They are great when you want to show the whole image and a relatively small number of frames from the movie. This movie has over 5000 frames so its montage would be absurd. But, it’s funny to show and a good example of how to make a montage.
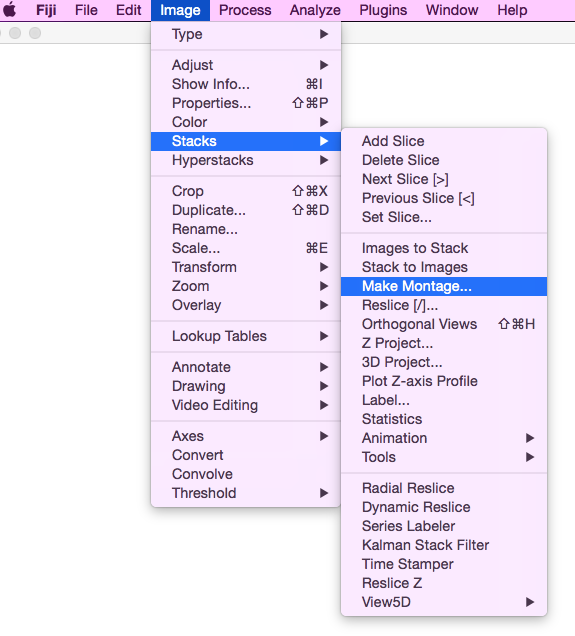
ImageJ calls a group of frames from a movie a “stack”, like a stack of sheets of paper or printed photos. To make a montage of all of the frames we choose on the menu:
Image->Stacks->Make Montage:
The result is here:
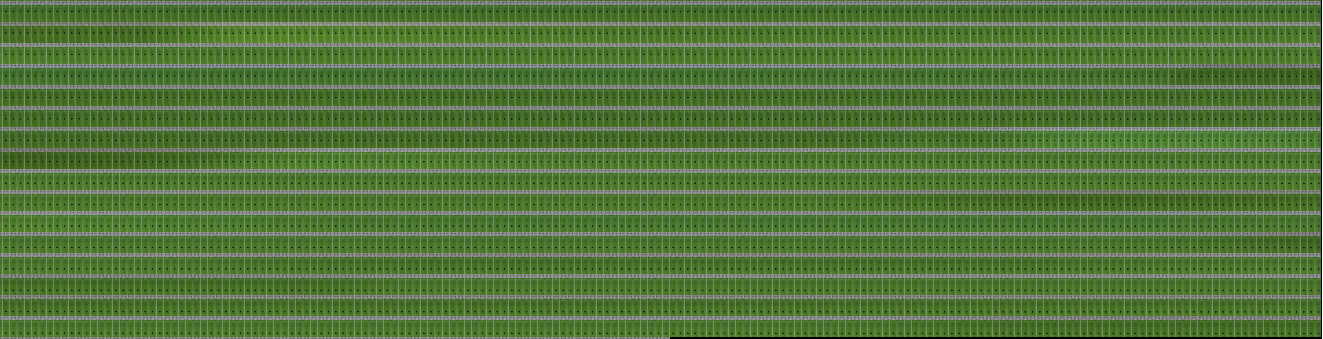
and it is useless. While we can (barely) see every frame, and the bead, it doesn’t help us do anything useful. We need a better way to study the motion without being overwhelmed.
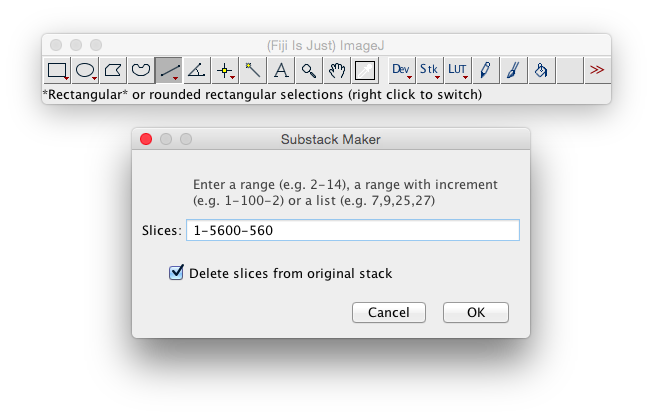
One fix is to make what is called a substack, a subset of the original frames. This helps us summarize key changes without exhausting detail. This is done from our original stack using
Image->Stacks->Tools->Make Substack
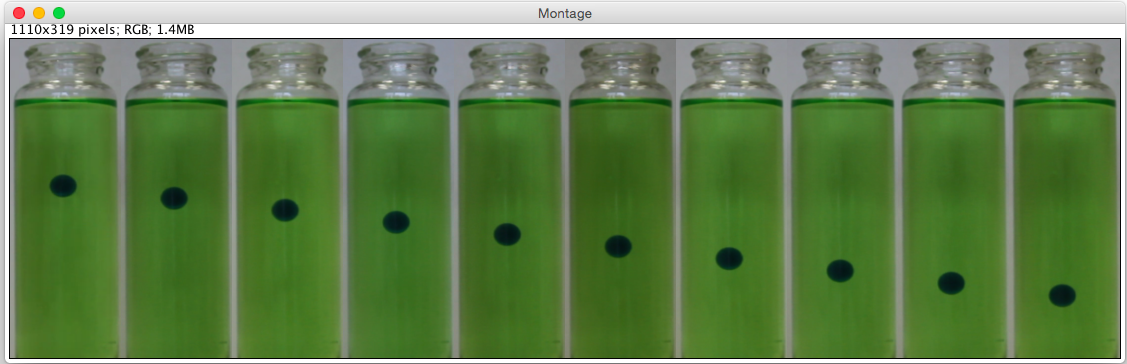
We know things change very little, so let’s reduce our 5600 frames into only 10. This requires making a substack composed of images taken every 560 frames from our original stack:
And we want them to be in a row so we choose one row and ten columns:
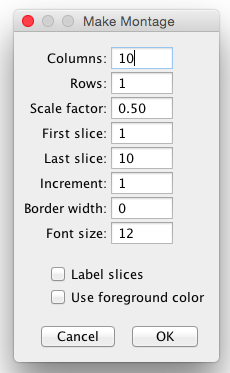
ImageJ will allow you to label each image with the time or frame number so your reader can see how fast things change. I prefer to do this in another software so it is more attractive. You also need to add a scale bar to indicate the absolute size of items in the image.
The result is here:
Example 1b - The Z-Project
What if we want to avoid the multiple frames of the montage but still summarize motion in a single image? One solution is known as the z-project, which is simply the combination of several images combined “on top” of one another. We perform this by choosing:
Image->Stacks->Z Project:
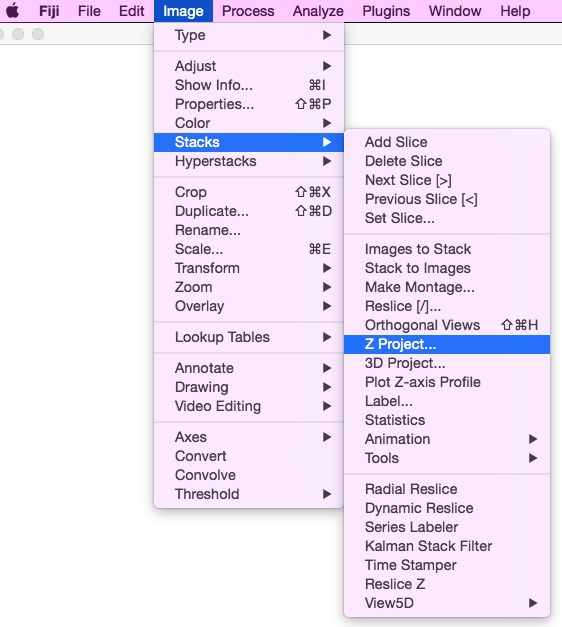
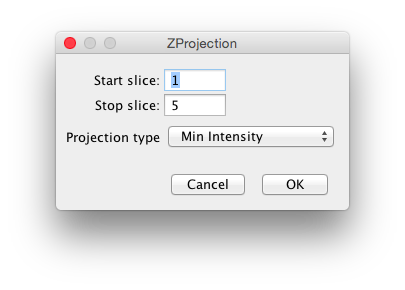
We have to choose what feature to emphasize in the projection
and here we pick the MIN or minimum of the images so we pick up the dark bead.
If we wanted the lighter colours we’d have used MAX.
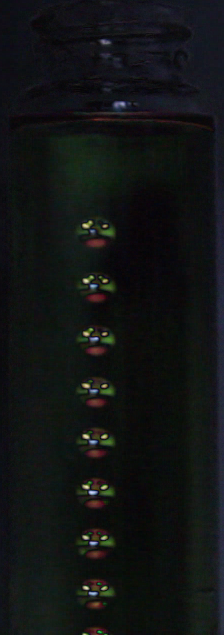
I made a new substack taking frames every 1120 frames so the beads don’t overlap each other. Our result:
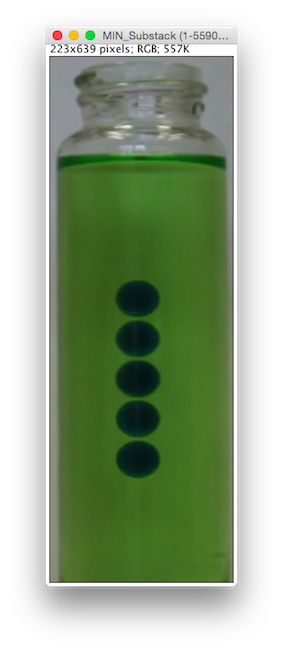
This isn’t bad, the spacing between beads is the same amount of time and the distance looks the same so we seem to have a nice uniform terminal velocity.
Example 1b - The Reslice
My favorite technique is the reslice, which preserves all the detail of the original movie and creates something like a plot of the motion so you can study and quantify it nicely. The reslice is done using a section of the image you choose to be sampled and then assembled together from the whole movie. To do it, first:
Click on the Line tool:
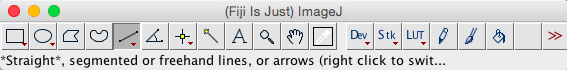
and draw a vertical line down the stack through the middle of the bead (hold down the Shift key to make it perfectly vertical. If you don’t position it on the center at first you can nudge it left or right after it is drawn with the arrow keys.):
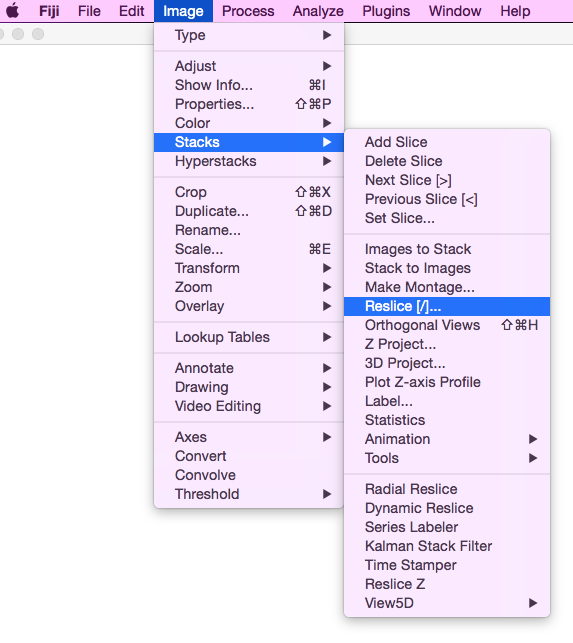
Then choose the following menu options:
Image->Stacks->Reslice:
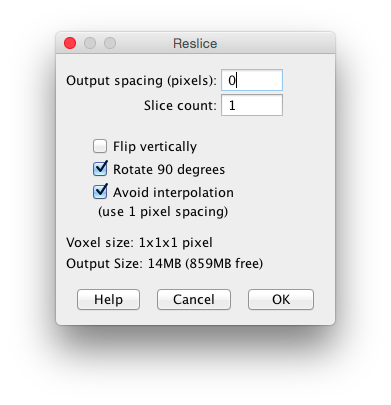
I like them to have no space between the slices to make a smooth image so I set spacing to zero:
 <
<
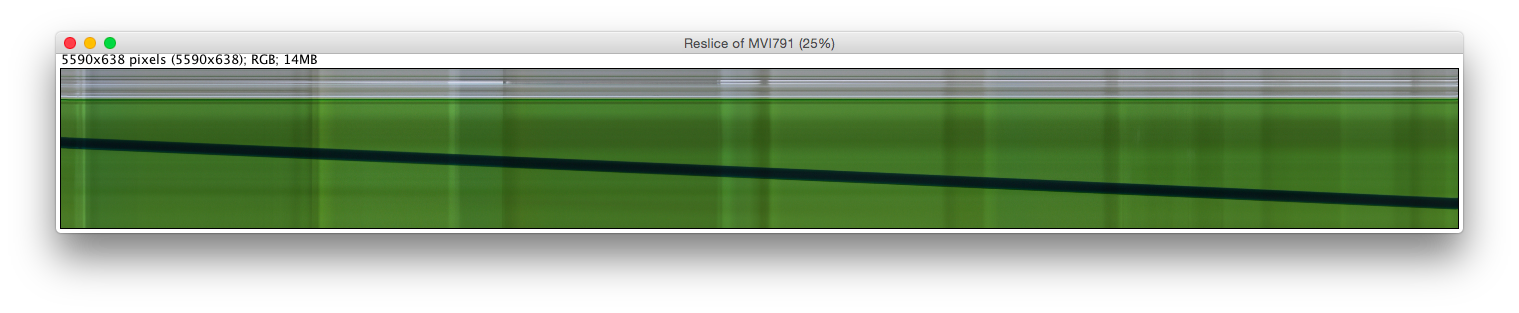
The result shows a wonderfully straight line, indicating the velocity (the line’s slope) does not change:
Example 2
Let’s try something different: a faster experiment. We achieve this with a smaller bead but one made of metal now. The metal will be more dense than the resin bead above so should fall faster.
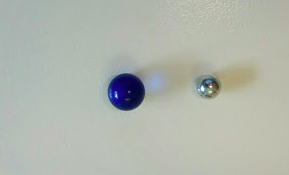
The steel bead, known in the US as a BB, is 4.5 mm in diameter and has a density around 8 g/cc, so it should fall around 8 times as fast as the plastic one.
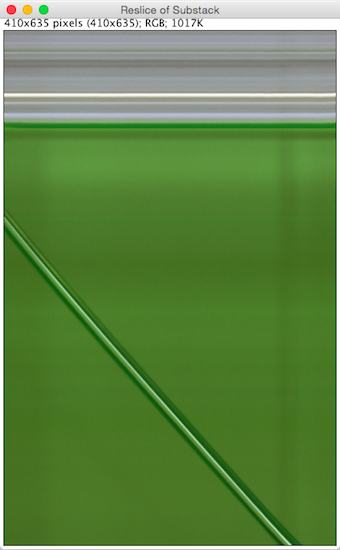
and it is speedy. So now let’s look at the reslice:
 <
<
If we look at this closely, the line representing the trajectory of the bead does not seem completely straight. We can verify this by drawing a line over it:
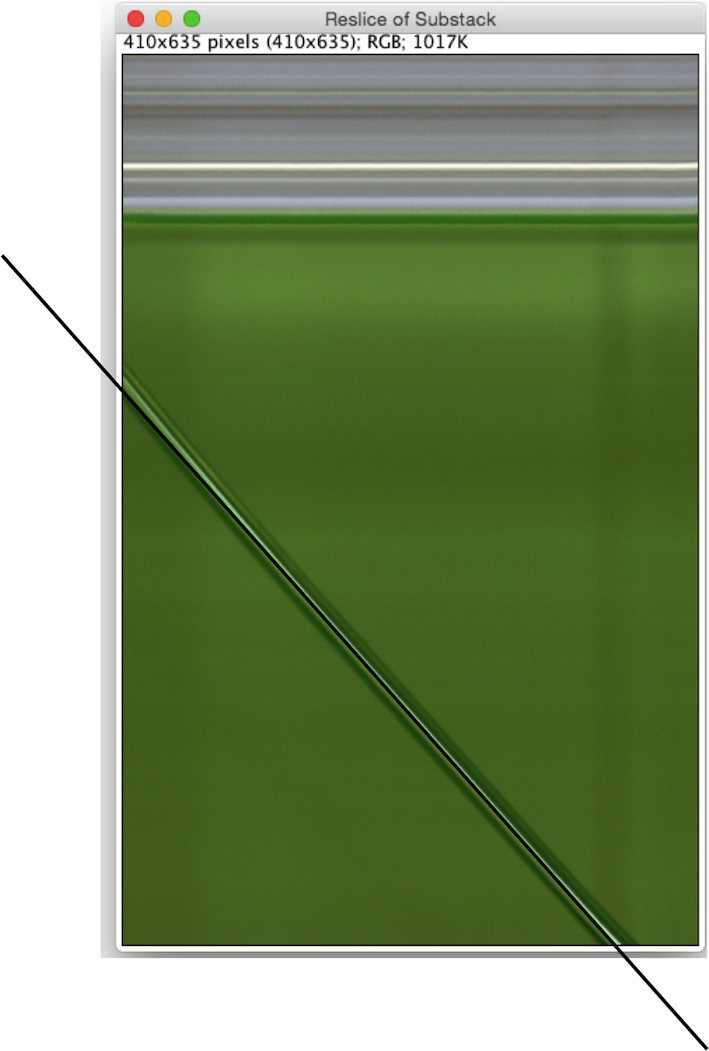
We see that the line is curved near the beginning and end of flow, meaning the bead velocity changes there. This could be because the flow is not fully developed when it starts because of end effects or it could be because the rheology of the fluid changes. I suspect some of each is happening here.
We might have seen this with a z-project, but it’s harder to be sure. Here is one using the standard deviation basis, to highlight change, rather than maximum or minimum:
I used an interval of 45 frames to separate the beads. The distance between the bead is larger at the beginning than the middle, but it is subtle. I think the reslice does a better job in this case.